


Charts: 2014 Public Fleet Overview
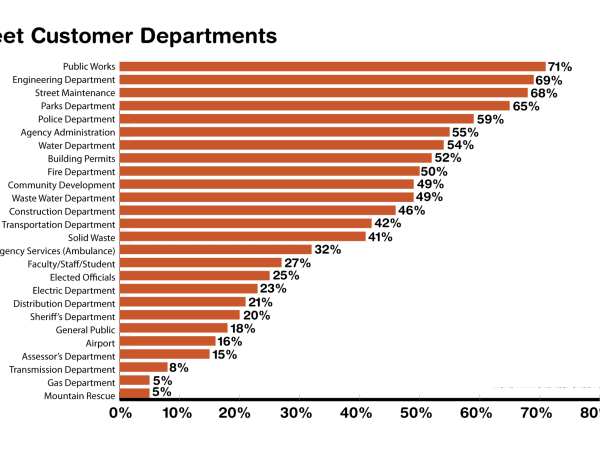
Fleet respondents serve various customer departments, the most common of which is Public Works.
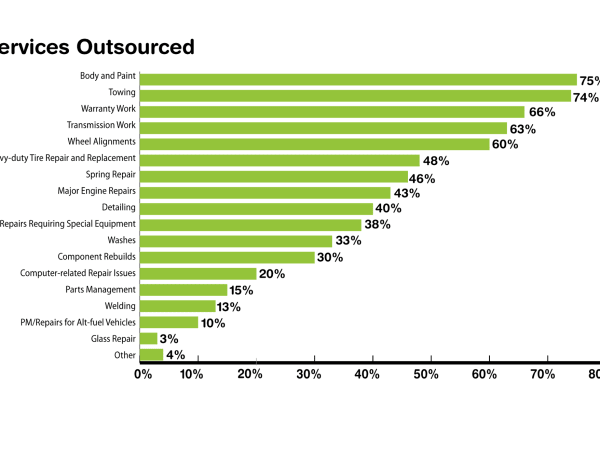
Fleet managers balance the work they do in-house with the staff they have with work that is more time-consuming, specialized, or requires special tools or equipment that they outsource. This chart shows the most commonly outsourced services. Responses in the “Other” category include upholstery work, police upfitting, and biocleaning.
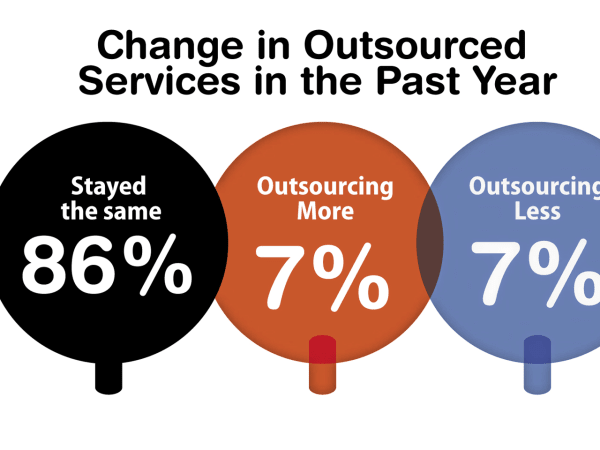
Fleets that began bringing work in-house that were previously outsourced say they are doing so because furloughs or hiring freezes had ended, they were moving toward a fully staffed operation, they were able to purchase more diagnostic equipment, or they hired an employee with specialized skills and was using this person for work that was previously outsourced.
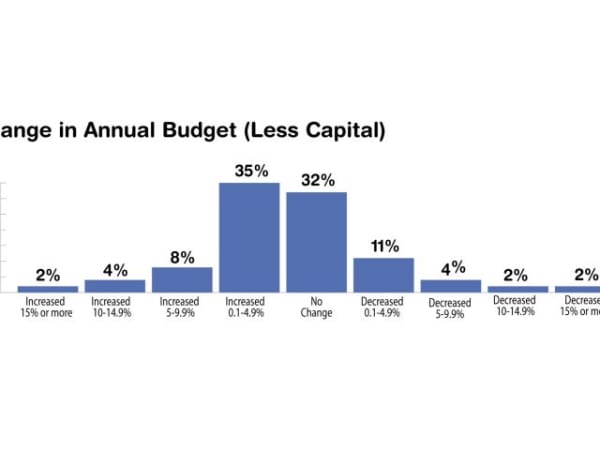
Many fleet budgets have risen this year, with 49% of respondents reporting an increase and about one-third reporting no changes. Results from the 2013 survey showed that 44% reported some increase in budget.
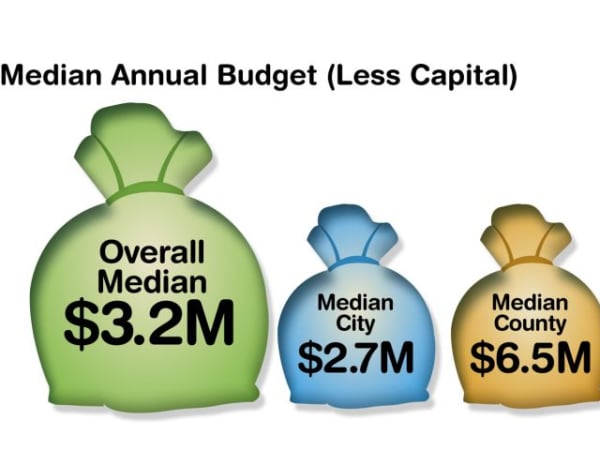
County fleets report having larger budgets than city fleets. Other totals are not calculated due to insufficient funds.
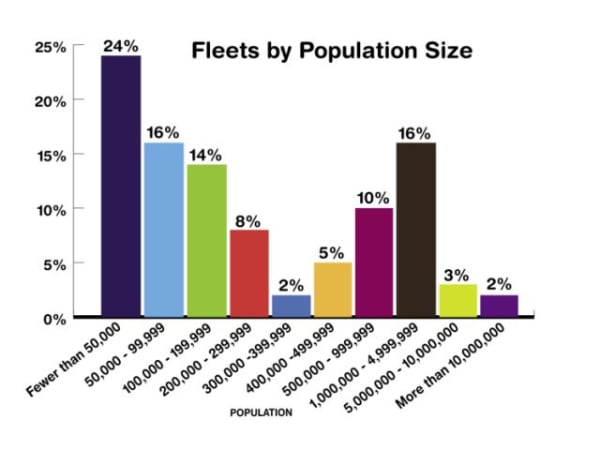
Nearly a quarter of respondents work for an agency that serves a population of less than 50,000 people.
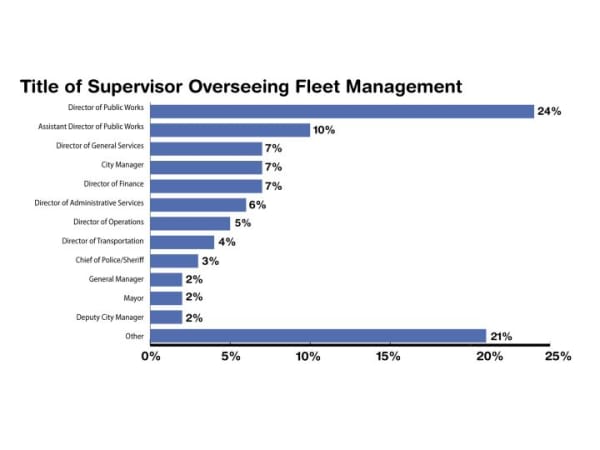
Director of Public Works is the mostcommon title of the person overseeing fleet management. This data is calculated from actual titles. Variances are often included in the "Other" category.