


Charts: Benchmarking Statistics 2017
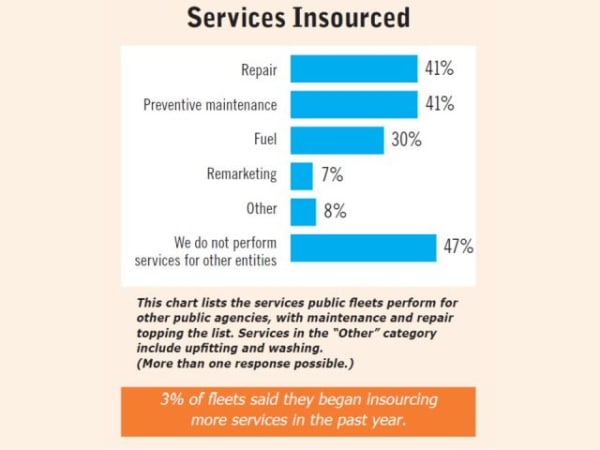
This chart lists the services public fleets perform for other public agencies, with maintenance and repair topping the list. Services in the “Other” category include upfitting and washing. (More than one response possible.)
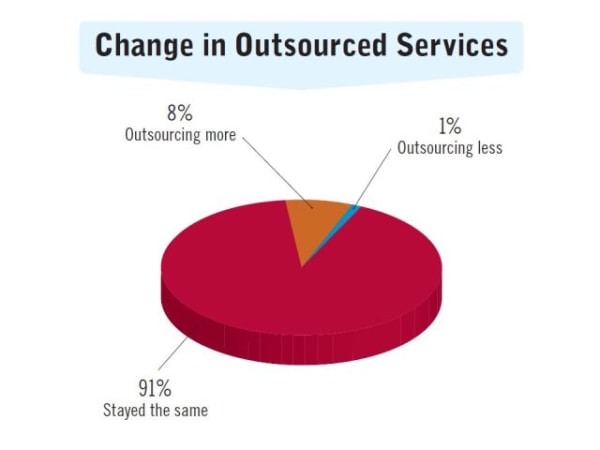
Those who are outsourcing more services said they did it due to the increasing age of the fleet, increasing diversification of the fleet, and being short on technicians. Some agencies began outsourcing upfitting while one fleet began doing it in-house.
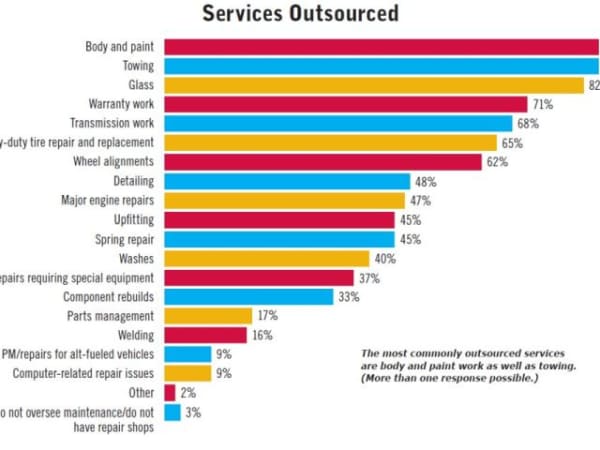
The most commonly outsourced services are body and paint work as well as towing. (More than one response possible.)

The majority of fleets provide tools and/or uniforms for employees, or allowances for them.
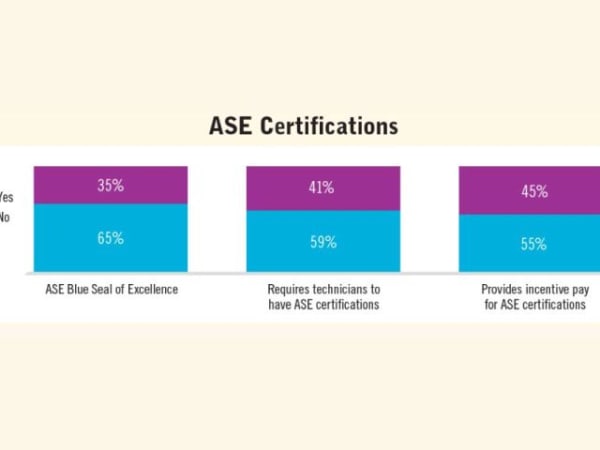
About one third of those surveyed said their shops have ASE (National Institute for Automotive Service Excellence) Blue Seal certifications. Of those fleets that have ASE Blue Seals, 67% require technicians to have ASE certifications and 63% provide incentive pay for ASE certifications.
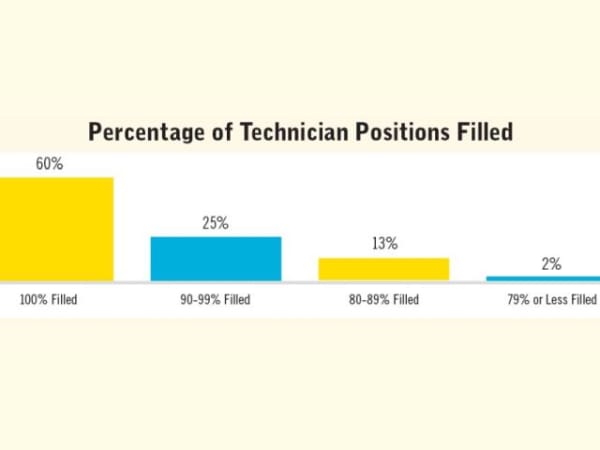
Respondents were asked how many of their allocated technician positions were currently filled, and 60% said they were fully staffed.
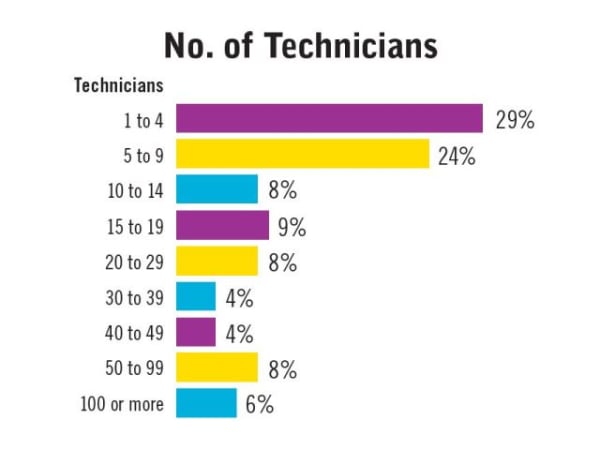
More than half of survey respondents reported having fewer than 10 technicians. Those with no technicians were not included in this chart.
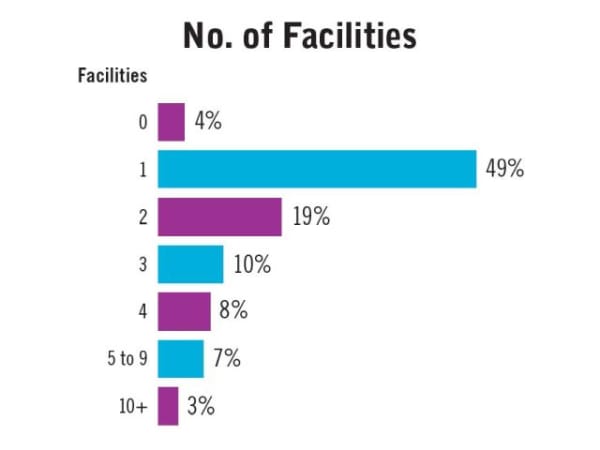
About half of fleet respondents reported having one maintenance facility.
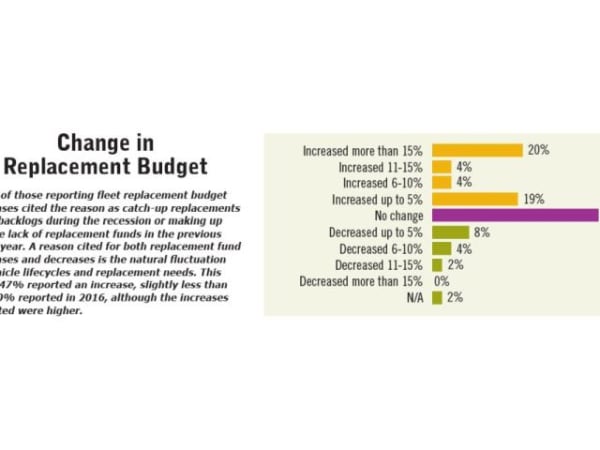
Many of those reporting fleet replacement budget increases cited the reason as catch-up replacements from backlogs during the recession or making up for the lack of replacement funds in the previous fiscal year. A reason cited for both replacement fund increases and decreases is the natural fluctuation of vehicle lifecycles and replacement needs. This year, 47% reported an increase, slightly less than the 50% reported in 2016, although the increases reported were higher.
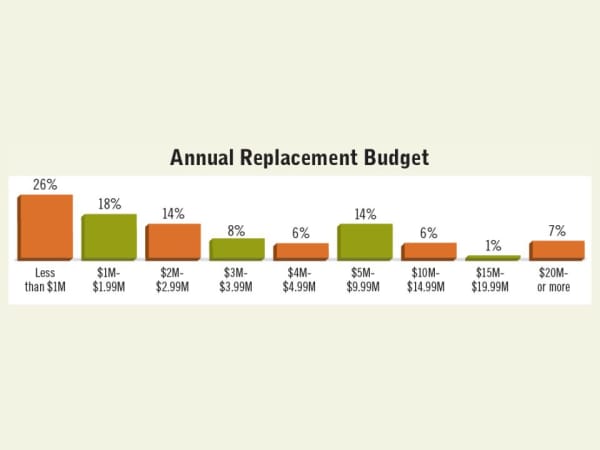
Of those respondents who reported having a fleet replacement budget, the median is $2.5 million.
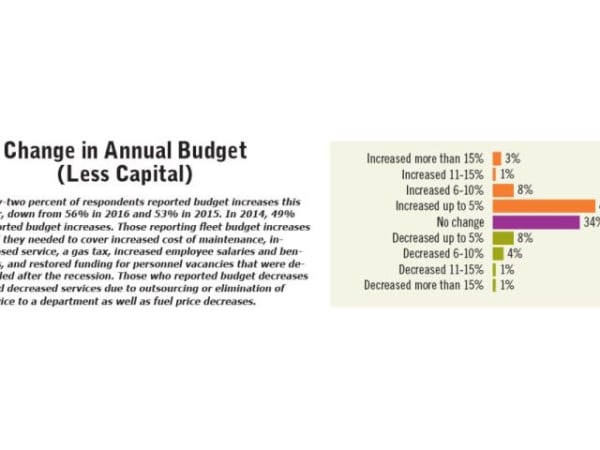
Fifty-two percent of respondents reported budget increases this year, down from 56% in 2016 and 53% in 2015. In 2014, 49% reported budget increases. Those reporting fleet budget increases said they needed to cover increased cost of maintenance, increased service, a gas tax, increased employee salaries and benefits, and restored funding for personnel vacancies that were defunded after the recession. Those who reported budget decreases cited decreased services due to outsourcing or elimination of service to a department as well as fuel price decreases.
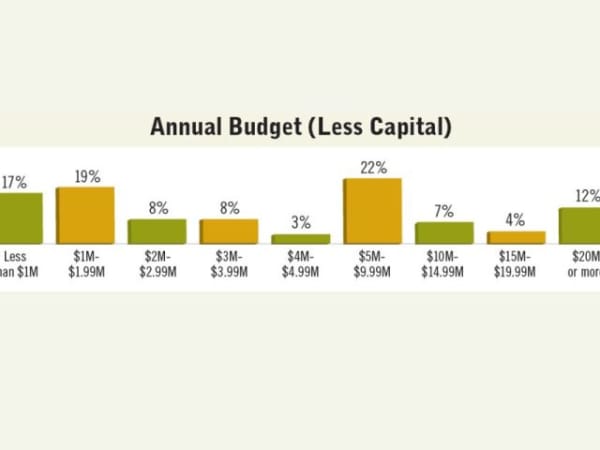
Survey respondents reported a range of budgets, with the median being $3.5 million.
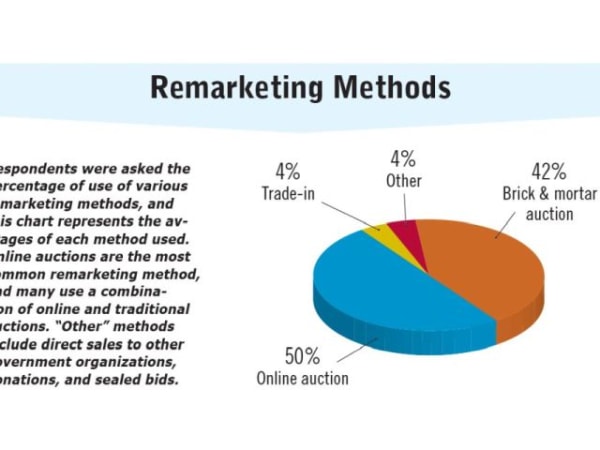
Respondents were asked the percentage of use of various remarketing methods, and this chart represents the averages of each method used. Online auctions are the most common remarketing method, and many use a combination of online and traditional auctions. “Other” methods include direct sales to other government organizations, donations, and sealed bids.
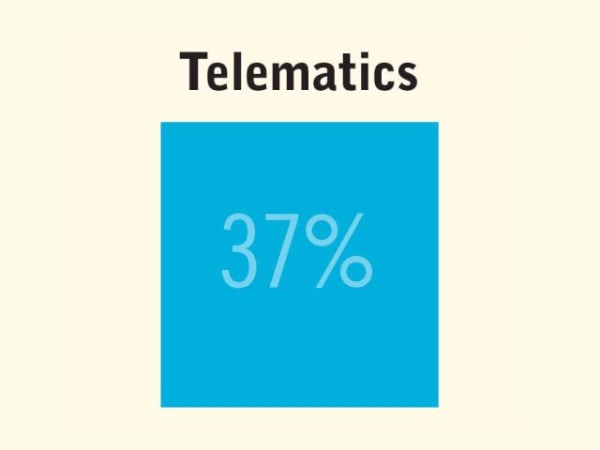
Of fleets using telematics, the percentage of on-road vehicles in their fleets with telematics is 37%.
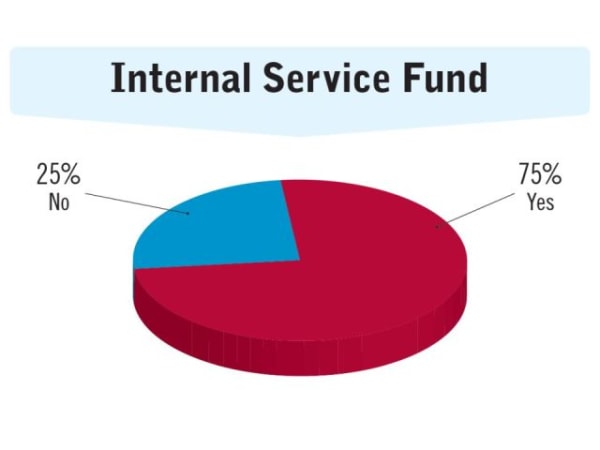
Three-quarters of fleet respondents are funded by internal service funds.
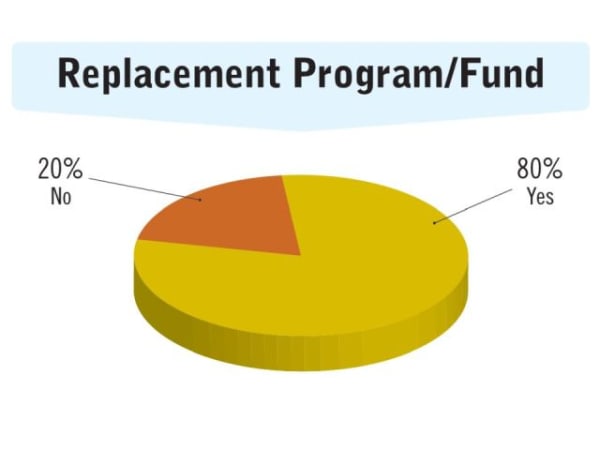
Four out of five respondents said their fleets have a replacement program and/or fund.
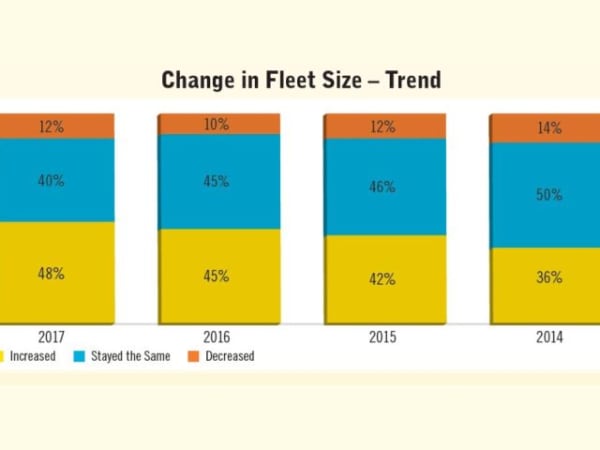
This graph tracks respondents’ reports of fleet size fluctuations since this question has been asked in GF’s annual survey, which began in 2014. Respondents report a steady increase in fleet growth.
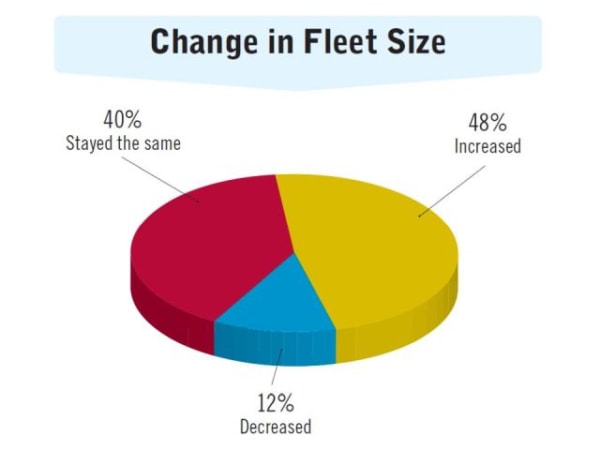
Respondents were asked how their fleet size had changed in the past year. Reasons for decreases include enforcing usage standards, removing obsolete or underutilized vehicles, eliminating take-home vehicles, outsourcing a major service, and reduced vehicle needs. Reasons cited for fleet size increases include: addition of new divisions or departments, addition of employees who need vehicles, expansion of services, fleet creep, the implementation of take-home vehicle programs, catch-up replacements, increases in city boundaries, or normal fluctuations.
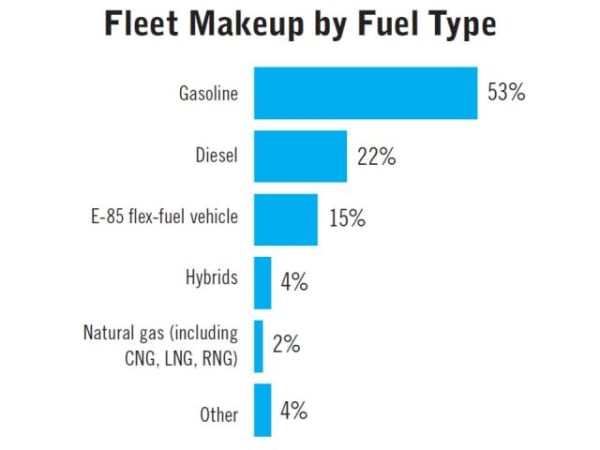
Respondents were asked to provide their fleet breakdown by fuel type used by vehicles. This chart shows the average vehicle makeup by fuel used. “Other” includes plug-in electric vehicles and propane autogas vehicles.
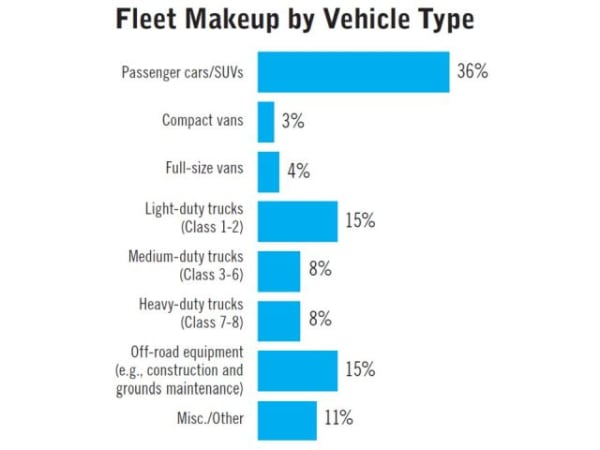
Respondents were asked to provide their fleet breakdown by vehicle type. This chart shows the average vehicle makeup of respondents.
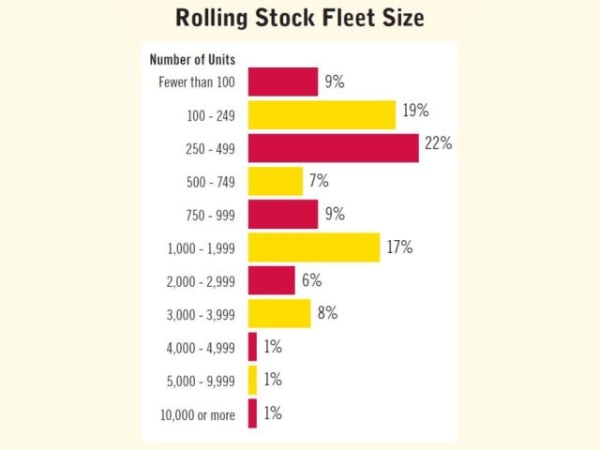
A significant number of those surveyed manage small fleets, with 50% of respondents overseeing fleets of fewer than 500 units.
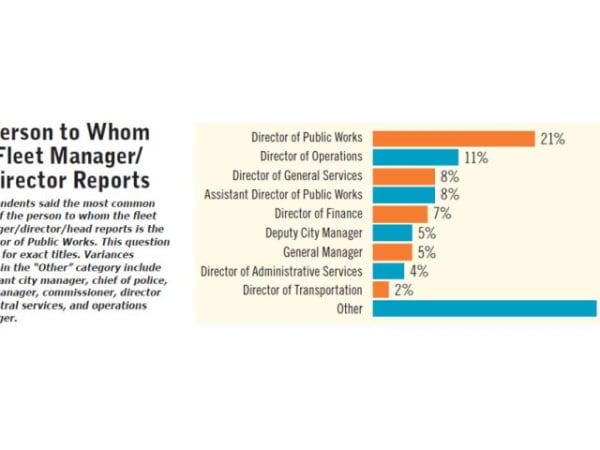
Respondents said the most common title of the person to whom the fleet manager/director/head reports is the Director of Public Works. This question asked for exact titles. Variances listed in the “Other” category include assistant city manager, chief of police, city manager, commissioner, director of central services, and operations manager.
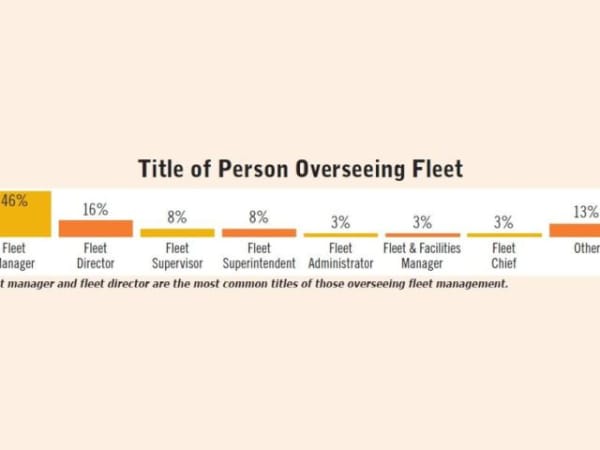
Fleet manager and fleet director are the most common titles of those overseeing fleet management.
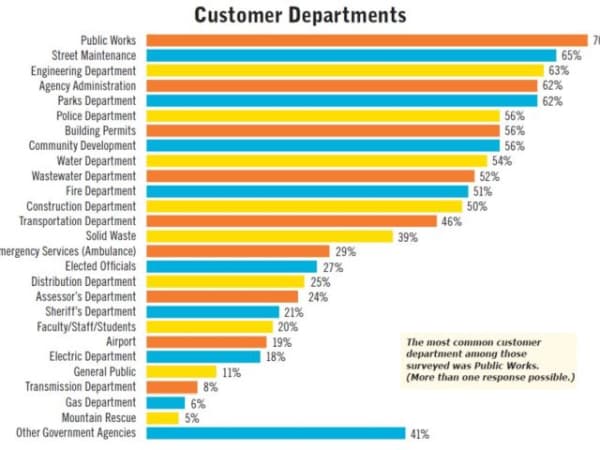
The most common customer department among those
surveyed was Public Works. (More than one response possible.)
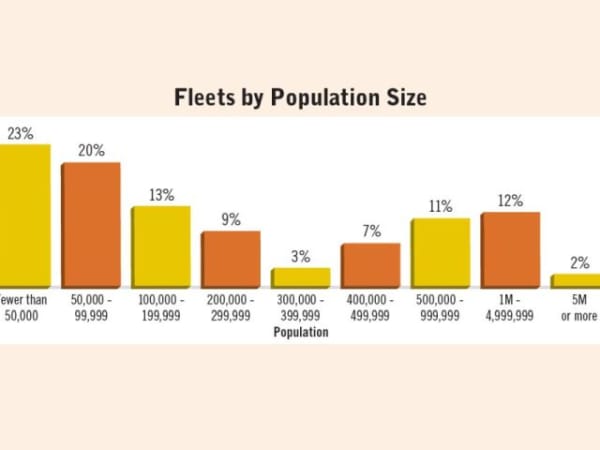
This graph breaks down the population of the public agencies where survey respondents work.
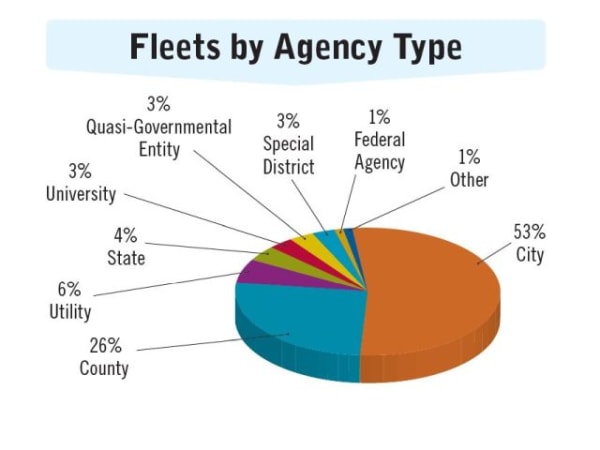
This chart shows a profile of survey respondents and the public entities for which they work. More than half of respondents work for city fleets.