


Charts: 2015 Public Fleet Overview
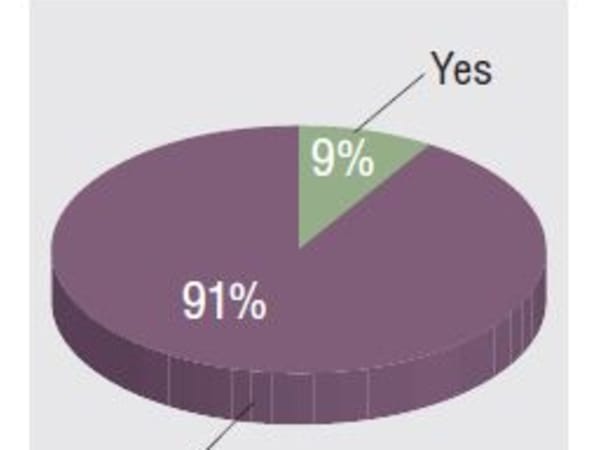
The majority of fleets that had changed their remarketing methods in the past year said they moved to online auctions.GF 2015 Industry Trends Survey
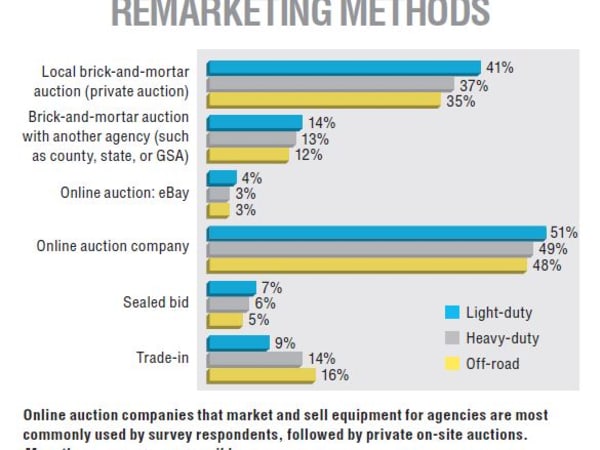
Online auction companies that market and sell equipment for agencies are most commonly used by survey respondents, followed by private on-site auctions. More than one response possible. Source: GF 2015 Industry Trends Survey
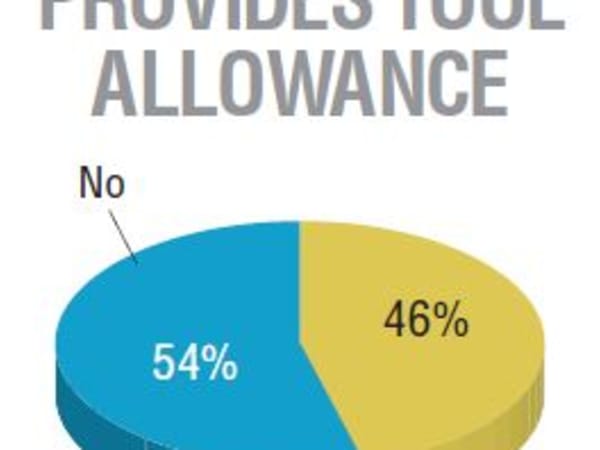
In the majority of fleet shops, technicians are required to bring in their own tools. For those that offer a tool allowance, the median annual allowance. Source: GF 2015 Industry Trends Survey
In the majority of fleet shops, technicians are required to bring in their own tools. For those that offer a tool allowance, the median annual allowance. Source: GF 2015 Industry Trends Survey
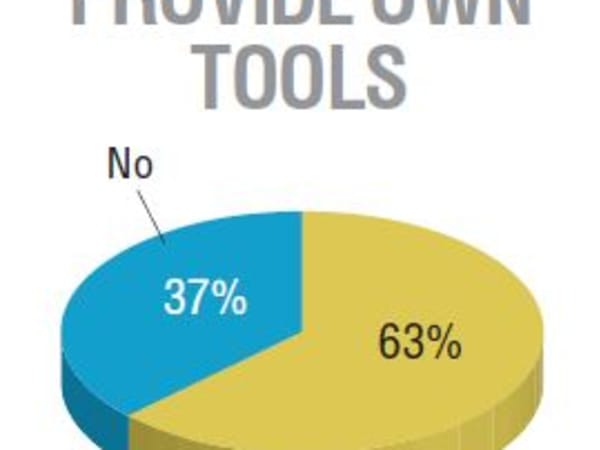
In the majority of fleet shops, technicians are required to bring in their own tools. For those that offer a tool allowance, the median annual allowance. Source: GF 2015 Industry Trends Survey
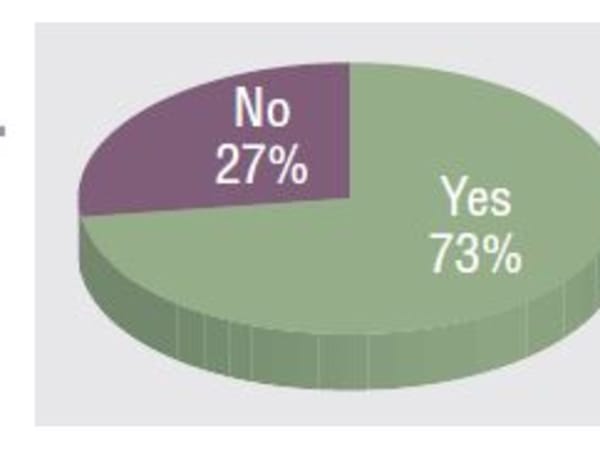
Almost three-quarters of respondents said their fleets are funded by internal service funds. Source: GF 2015 Industry Trends Survey
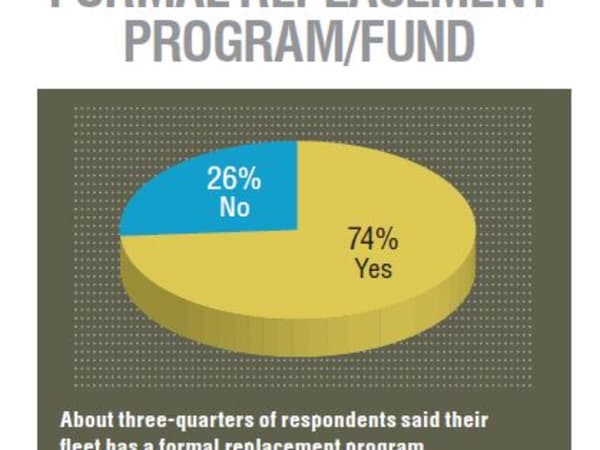
About three-quarters of respondents said their fleet has a formal replacement program. Source: GF 2015 Industry Trends Survey
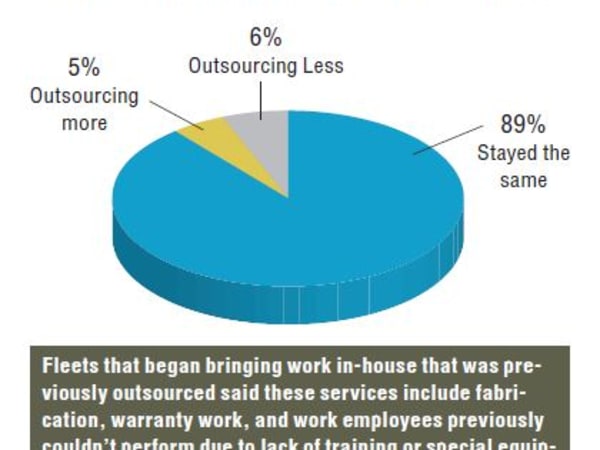
Fleets that began bringing work in-house that was previously outsourced said these services include fabrication, warranty work, and work employees previously couldn’t perform due to lack of training or special equipment. Fleets outsourcing more services said they sent out parts warehousing, specialized repairs, and other services due to lack of staff or training. Source: GF 2015 Industry Trends Survey
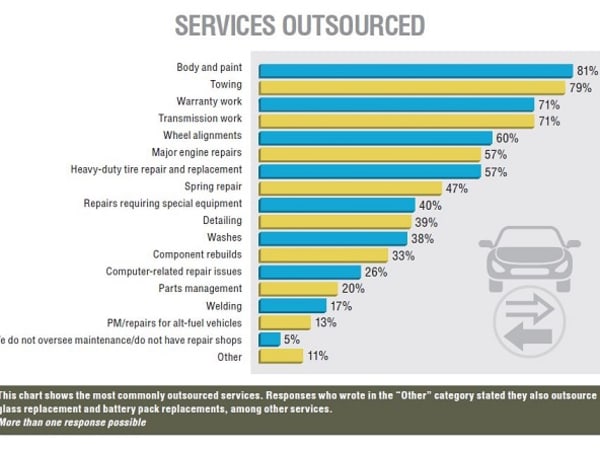
This chart shows the most commonly outsourced services. Responses who wrote in the “Other” category stated they also outsource glass replacement and battery pack replacements, among other services. More than one response possible. Source: GF 2015 Industry Trends Survey
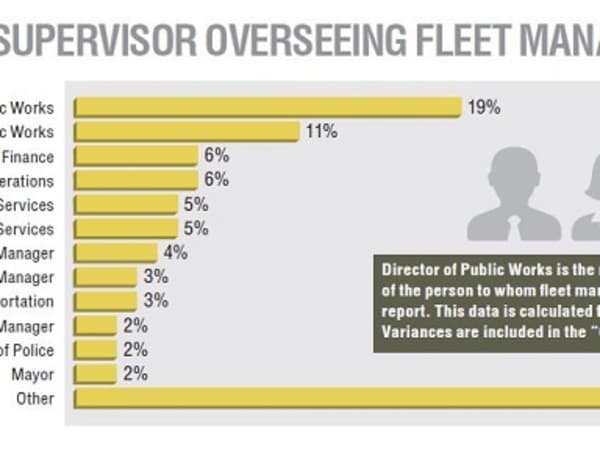
Director of Public Works is the most common title
of the person to whom fl eet managers/directors report. This data is calculated from actual titles.Variances are included in the “Other” category. Source: GF 2015 Industry Trends Survey
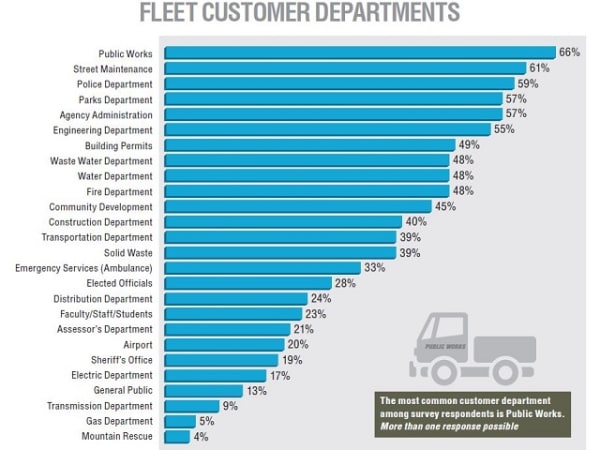
The most common customer department among survey respondents is Public Works. More than one response possible. Source: GF 2015 Industry Trends Survey
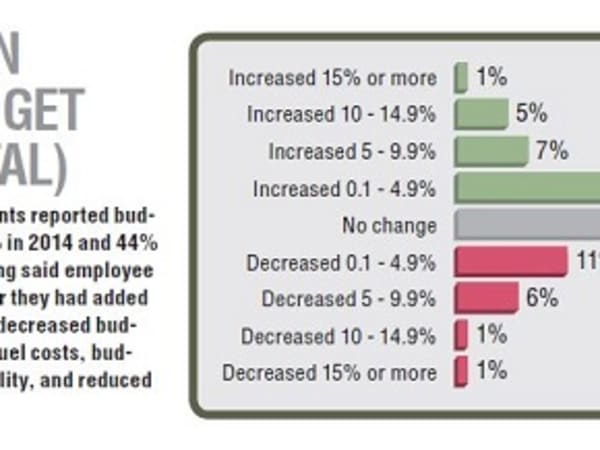
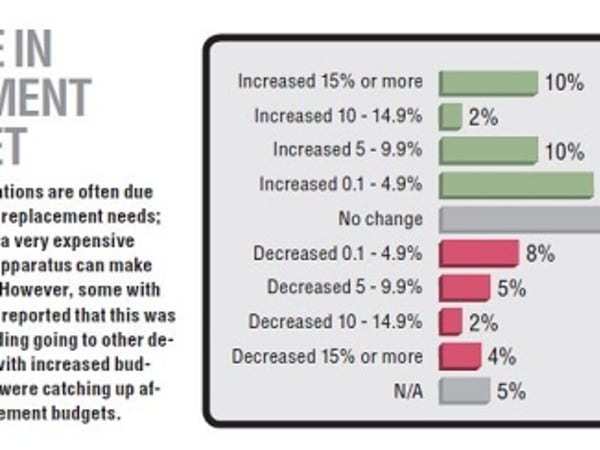
Fifty-three percent of fl eet respondents reported budget increases this year, up from 49% in 2014 and 44% in 2013. Fleets with increased funding said employee
salary and benefi ts had increased, or they had added technicians or vehicles. Fleets with decreased budgets
most commonly cited reduced fuel costs, budget cuts and limited funding availability, and reduced staff and downsizing as reasons. Source: GF 2015 Industry Trends Survey
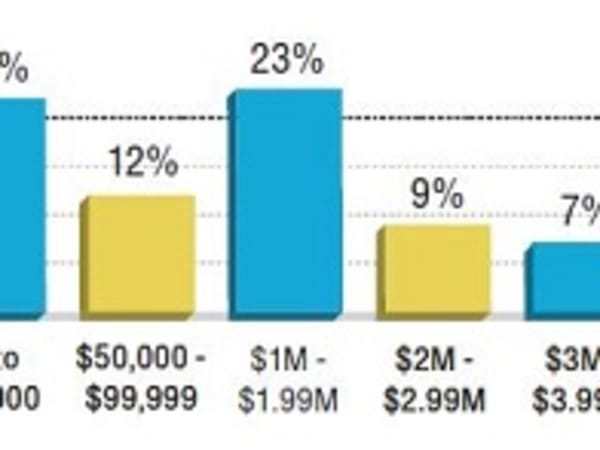
The median fleet replacement budgets of survey respondents is $1.5 million. Source: GF 2015 Industry Trends Survey
Fleet replacement budget fl uctuations are often due to natural vehicle life cycles and replacement needs; some fleets noted that replacing a very expensive piece of equipment such as fi re apparatus can make replacement funding skyrocket. However, some with decreased replacement budgets reported that this was due to budget cuts or capital funding going to other departments. Nearly half of those with increased budgets of more than 15% said they were catching up after years of under-funded replacement budgets. Source: GF 2015 Industry Trends Survey
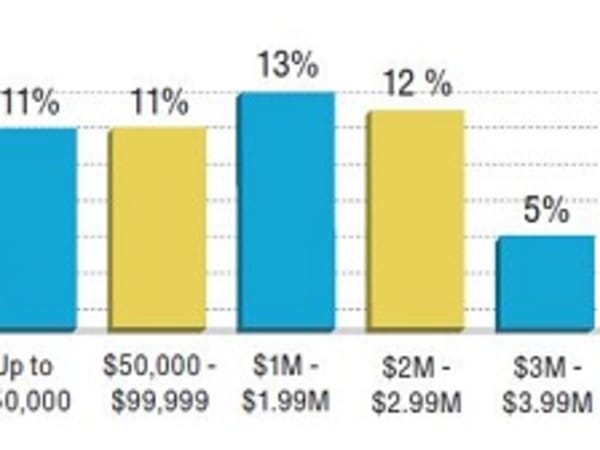
The median annual operating budget of survey respondents is $3.5 million. Source: GF 2015 Industry Trends Survey
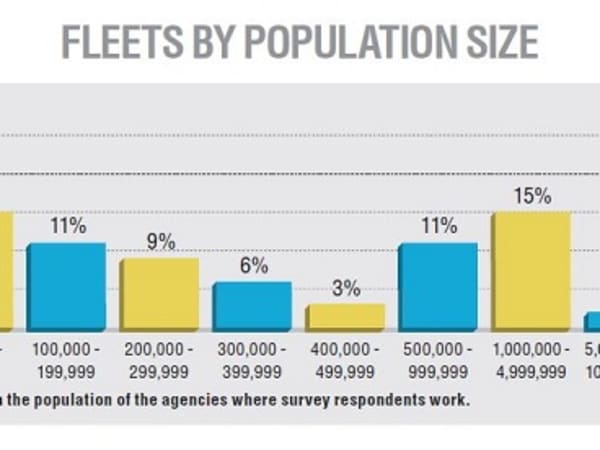
This graph breaks down the population of the agencies where survey respondents work. Source: GF 2015 Industry Trends Survey
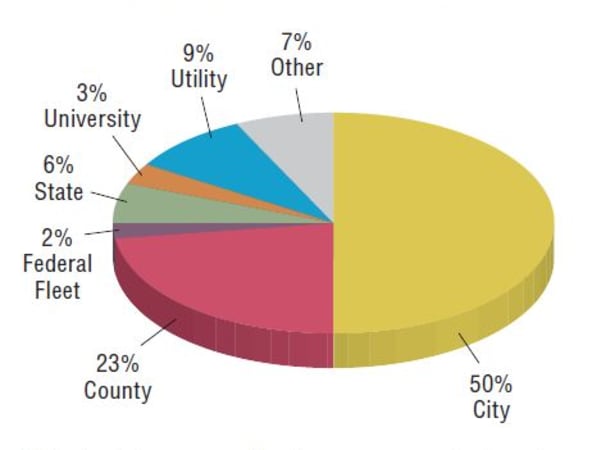
This chart shows a profile of survey respondents and the public entities for which they work. The “other” category consists of special districts, transit agencies, fire divisions, and other uncategorized agencies. Source: GF 2015 Industry Trends Survey