


2016 Federal Fleet Statistics
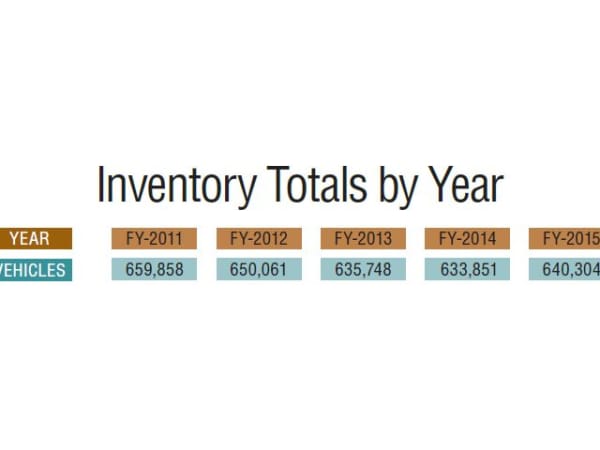
The federal fleet size consistently decreased until 2015, when it rose by 1%.
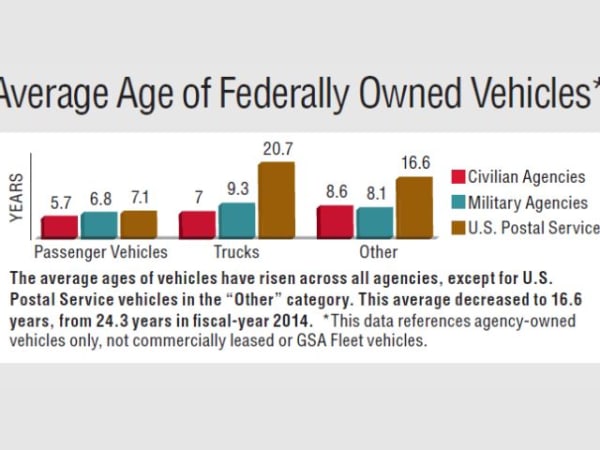
The average ages of vehicles have risen across all agencies, except for U.S. Postal Service vehicles in the "Other" category. This average decreased to 16.6 years, from 24.3 years in fiscal-year 2014. *This data references agency-owned vehicles only, not commercially leased of GSA Fleet vehicles
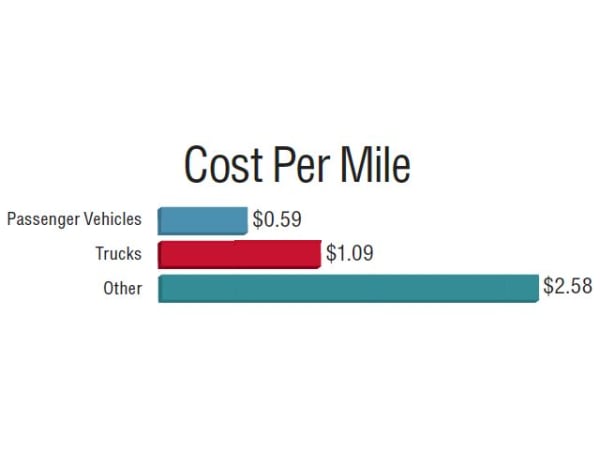
Cost per mile for passenger vehicles and trucks has decreased from 2014, while CPM for "other" vehicles increased from $2.29 in 2014.
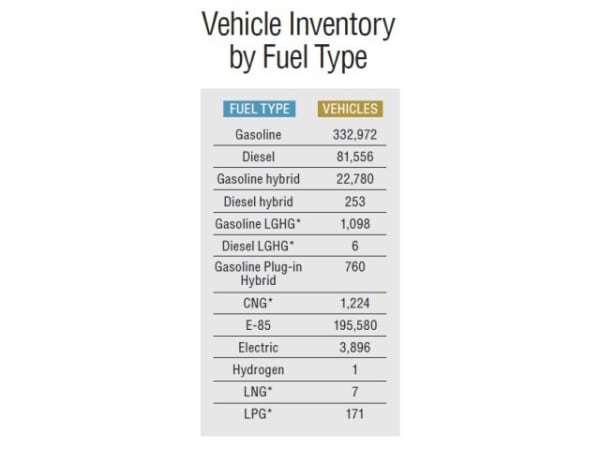
Gasoline vehicle totals have decreased by 2% from the previous year, while diesel vehicles have increased by almost 1%. The number of hybrids and flex-fuel vehicles has increased, while the number of CNG and electric vehicles has decreased. *Abbreviations: LGHG - low greenhouse gas; CNG - compressed natural gas; LNG - liquefied natural gas; LPG - Liquefied petroleum gas
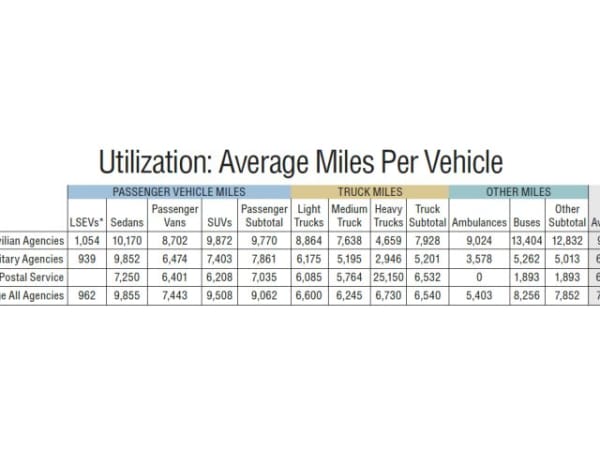
This table shows the average miles traveled per vehicle type in fiscal-year 2015. Compared to fiscal-year 2014, utilization has increased overall in comparison to the prior year. Civilian agencies and the U.S. Postal Service increased utilization, while military agencies' vehicle utilization decreased slightly.