


2016 Benchmarking Statistics
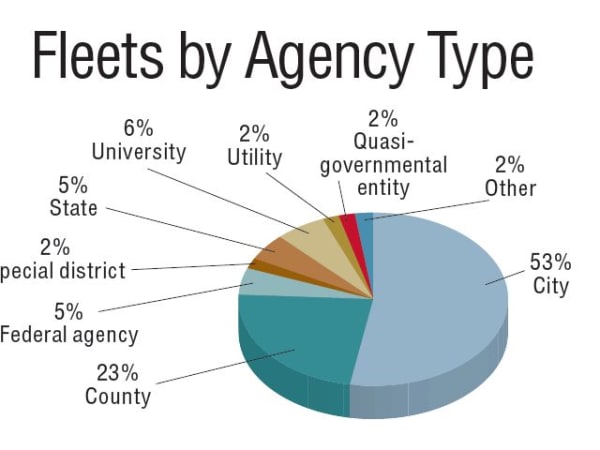
This chart shows a profile of survey respondents and the public entities for which they work. The “City” category includes villages and towns. “Other” includes port authorities, transit, and fire districts.
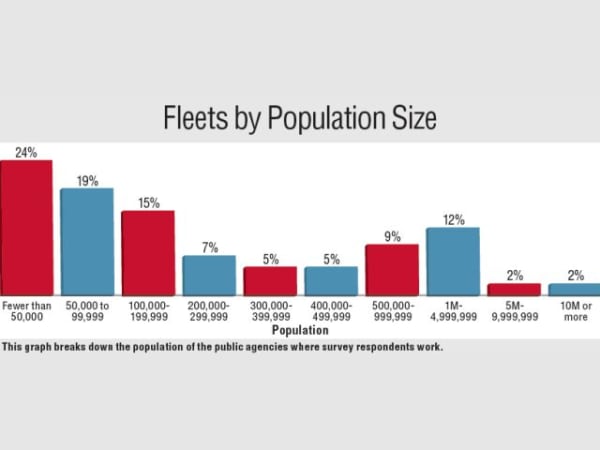
This graph breaks down the population of the public agencies where survey respondents work.
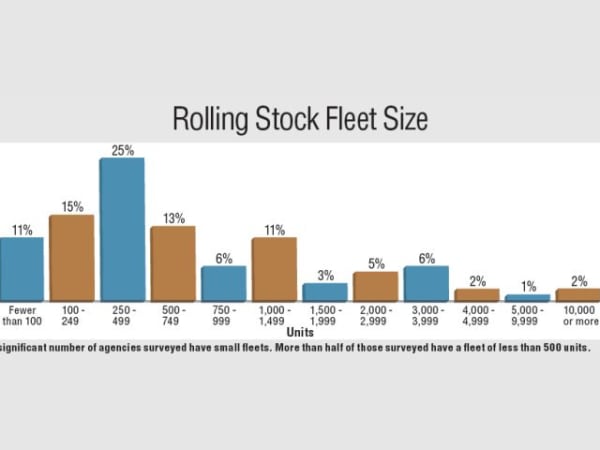
A significant number of agencies surveyed have small fleets. More than half of those surveyed have a fleet of less than 500 units.
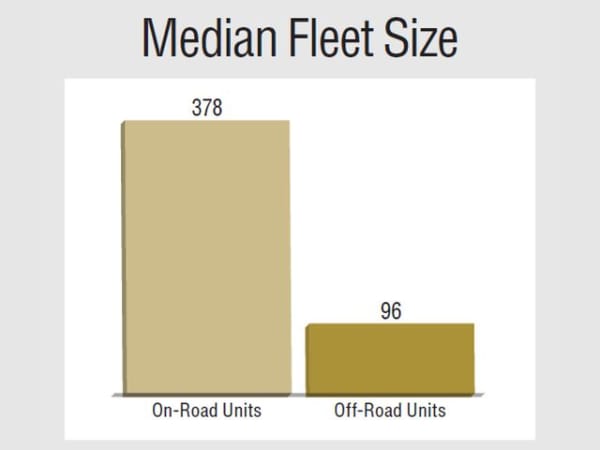
On-road vehicles range from sedans to heavy-duty trucks; off-road units include construction equipment, mowers, etc. About 9% of respondents reported having no off-road units.
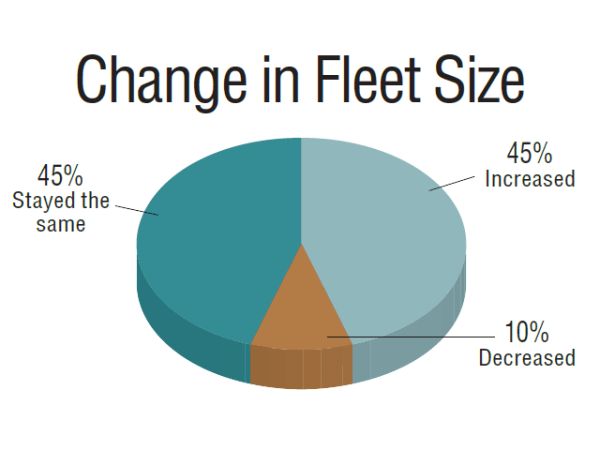
Fleet respondents were asked how their fleet size had changed in the past year. A slightly higher percentage reported an increase this year: 45% compared to 42% in 2015 and 36% in 2014. Those reporting fleet size decreases reduced, with 10% this year, 12% in 2015, and 14% in 2014. Those who had reduced their fleet size cited fleet reduction efforts and decreased transportation requirements. Those with increased fleet sizes cited growing agencies and departments as well as growing transportation demands.
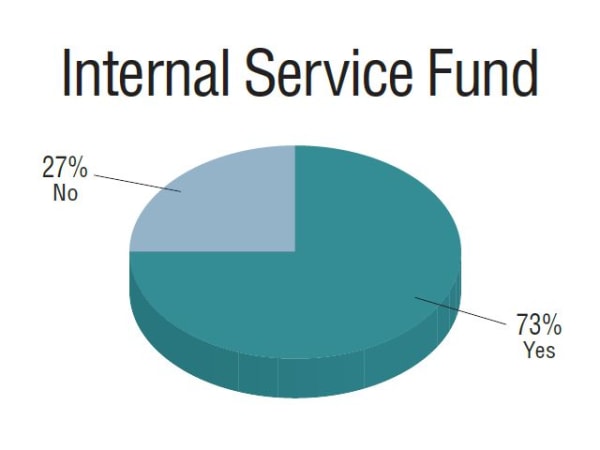
Almost three-quarters of fleet respondents are funded by internal service funds.
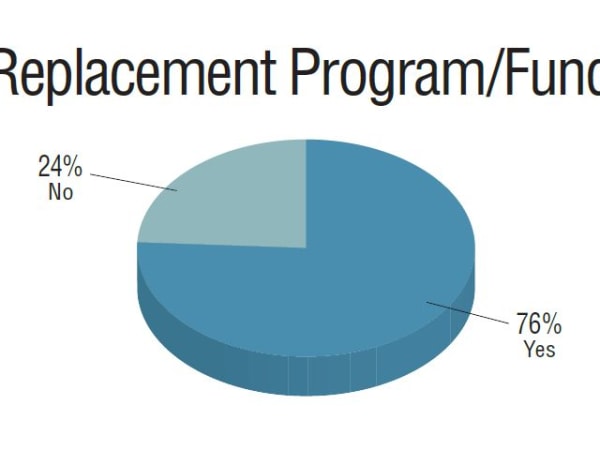
More than three quarters of respondents said their fleets have a replacement program and/or fund.
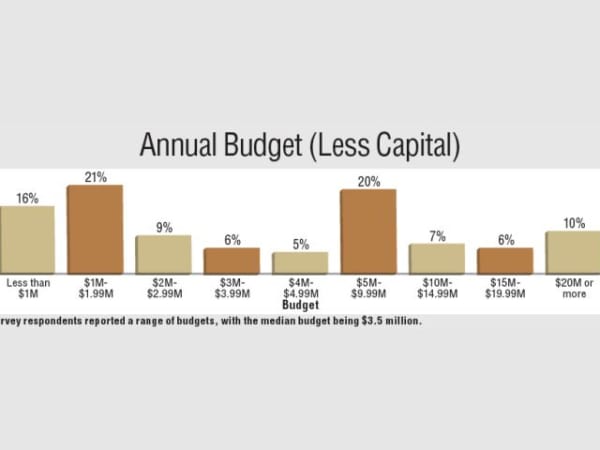
Survey respondents reported a range of budgets, with the median budget being $3.5 million.
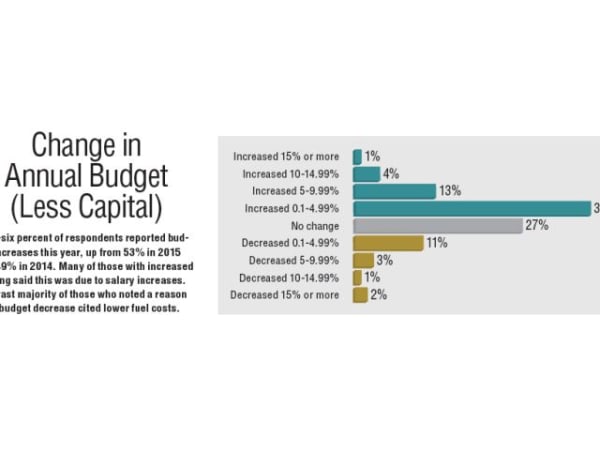
Fifty-six percent of respondents reported budget increases this year, up from 53% in 2015 and 49% in 2014. Many of those with increased funding said this was due to salary increases. The vast majority of those who noted a reason for a budget decrease cited lower fuel costs.
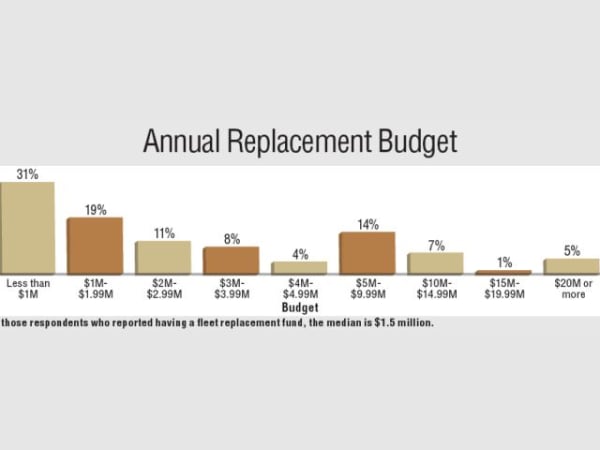
Of those respondents who reported having a fleet replacement fund, the median is $1.5 million.
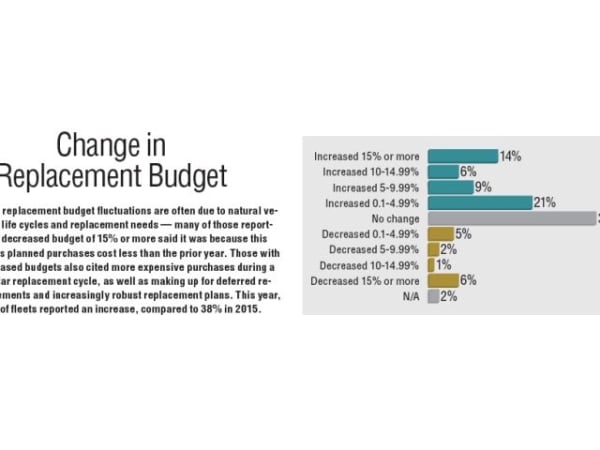
Fleet replacement budget fluctuations are often due to natural vehicle life cycles and replacement needs — many of those reporting a decreased budget of 15% or more said it was because this
year’s planned purchases cost less than the prior year. Those with increased budgets also cited more expensive purchases during a regular replacement cycle, as well as making up for deferred replacements and increasingly robust replacement plans. This year, 50% of fleets reported an increase, compared to 38% in 2015.
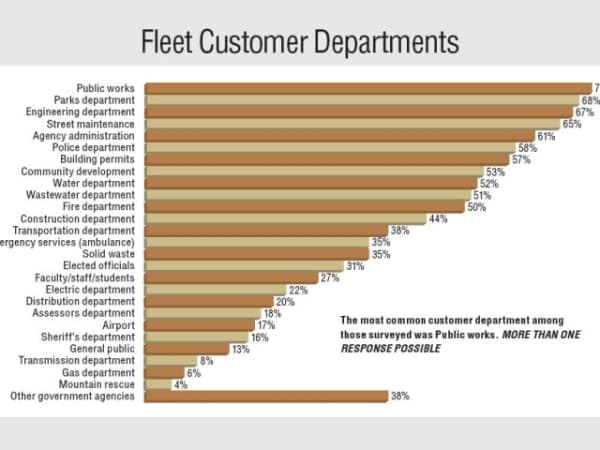
The most common customer department among those surveyed was Public Works. More than one response possible
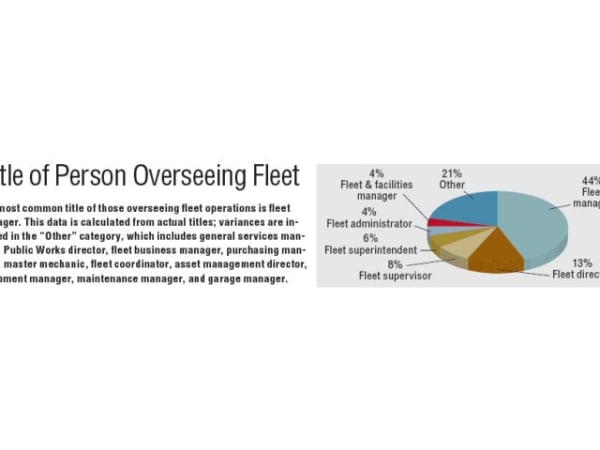
The most common title of those overseeing fleet operations is fleet manager. This data is calculated from actual titles; variances are included in the “Other” category, which includes general services manager, Public Works director, fleet business manager, purchasing manager, master mechanic, fleet coordinator, asset management director, equipment manager, maintenance manager, and garage manager.
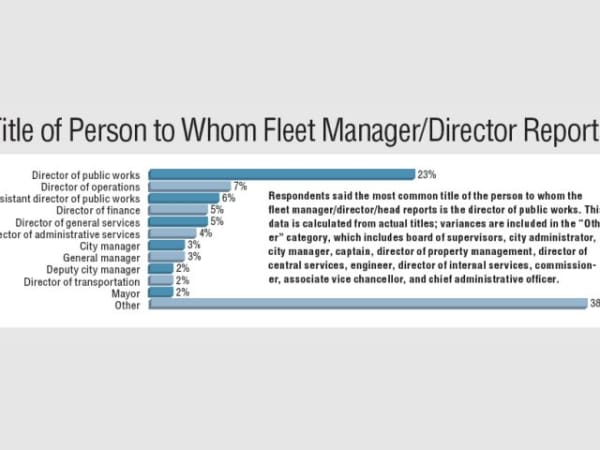
Respondents said the most common title of the person to whom the fleet manager/director/head reports is the director of public works. This data is calculated from actual titles; variances are included in the “Other” category, which includes board of supervisors, city administrator, city manager, captain, director of property management, director of central services, engineer, director of internal services, commissioner, associate vice chancellor, and chief administrative officer.
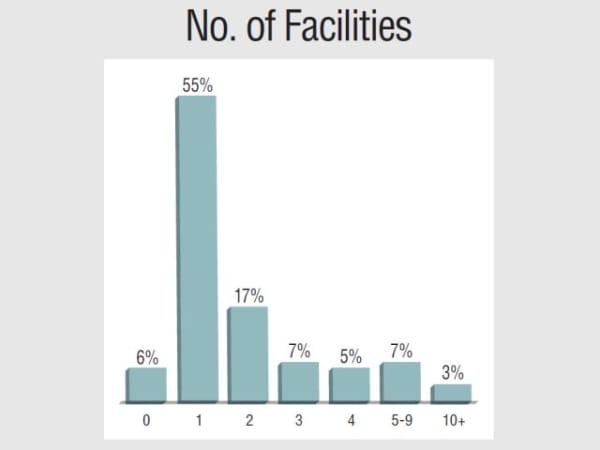
More than half of respondents had one fleet maintenance facility.
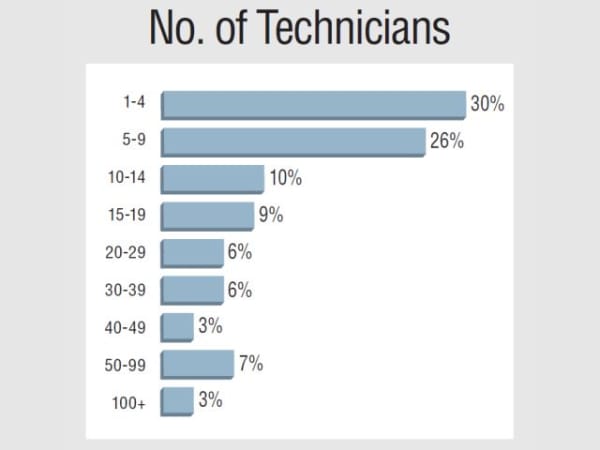
More than half of survey respondents reported having less than 10 technicians. Respondents with more than 100 technicians reported having at least 10 maintenance facilities. Those who had no technicians were not included in this chart.
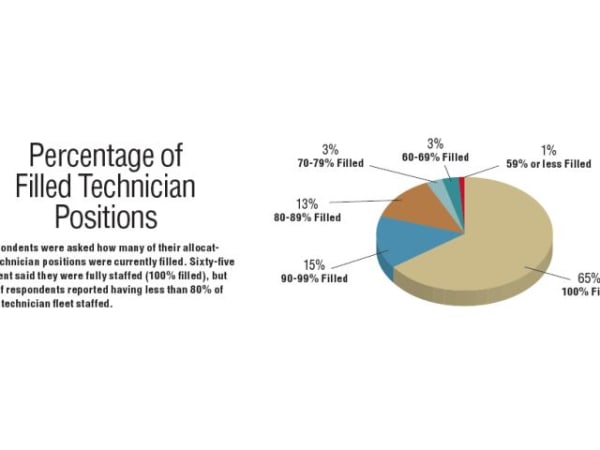
Respondents were asked how many of their allocated technician positions were currently filled. Sixty-five percent said they were fully staffed (100% filled), but 7% of respondents reported having less than 80% of their technician fleet staffed.
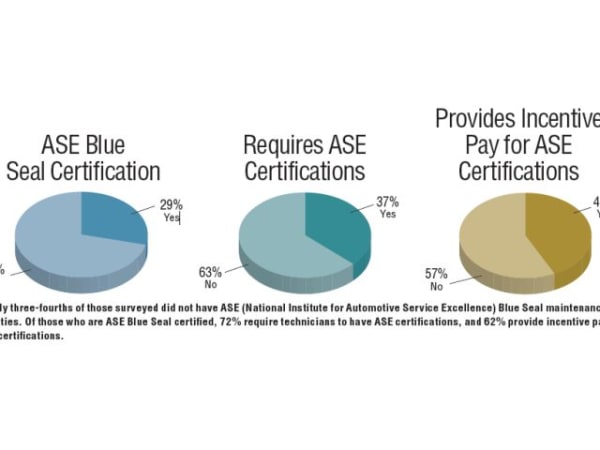
Nearly three-fourths of those surveyed did not have ASE (National Institute for Automotive Service Excellence) Blue Seal maintenance facilities. Of those who are ASE Blue Seal certified, 72% require technicians to have ASE certifications, and 62% provide incentive pay for ASE certifications.
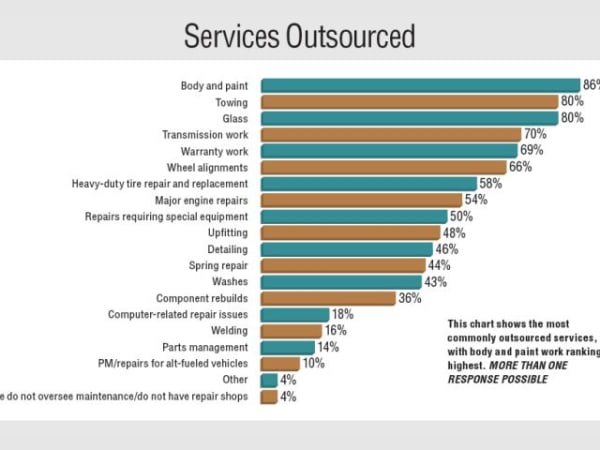
This chart shows the most commonly outsourced services, with body and paint work ranking highest. More than one response possible
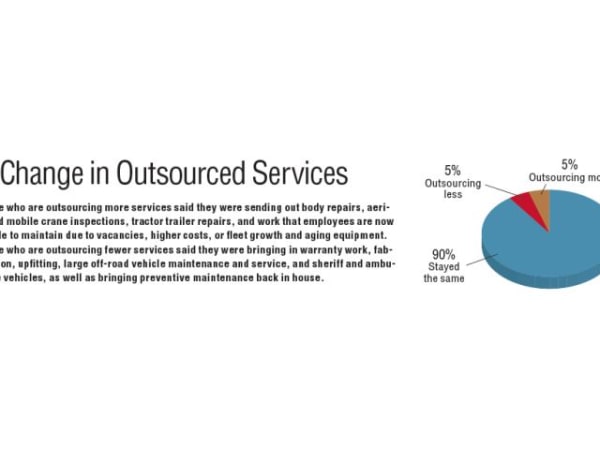
Those who are outsourcing more services said they were sending out body repairs, aerial and mobile crane inspections, tractor trailer repairs, and work that employees are now unable to maintain due to vacancies, higher costs, or fleet growth and aging equipment. Those who are outsourcing fewer services said they were bringing in warranty work, fabrication, upfitting, large off-road vehicle maintenance and service, and sheriff and ambulance vehicles, as well as bringing preventive maintenance back in house.
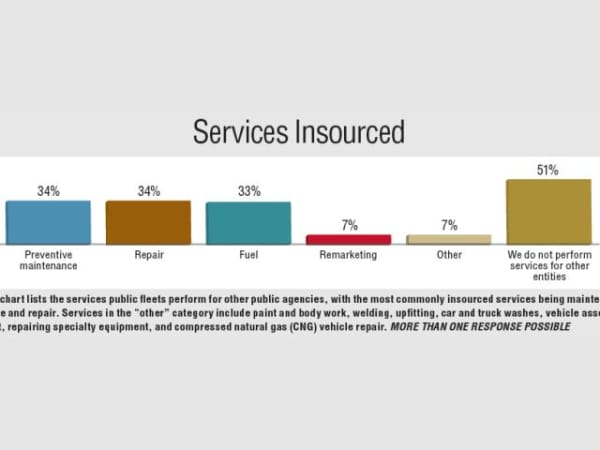
This chart lists the services public fleets perform for other public agencies, with the most commonly insourced services being maintenance and repair. Services in the “other” category include paint and body work, welding, upfitting, car and truck washes, vehicle assessment, repairing specialty equipment, and compressed natural gas (CNG) vehicle repair. More than one response possible
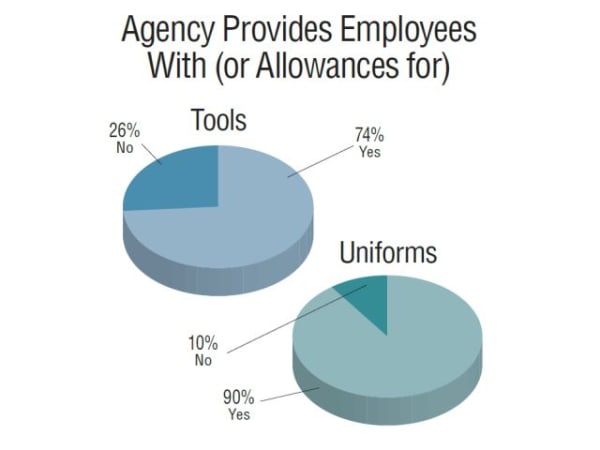
The majority of public fleets provide tools and/or uniforms for employees, or allowances for them.
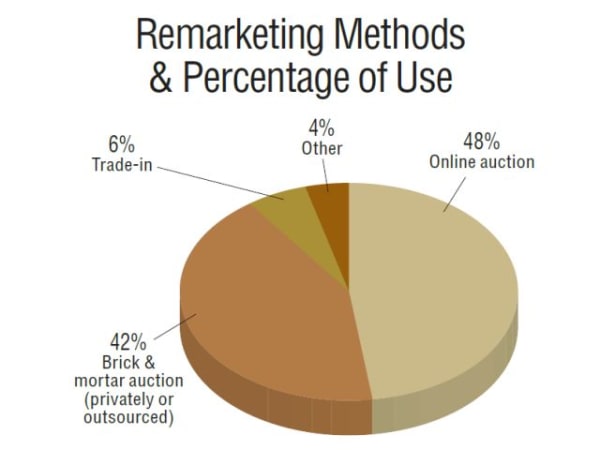
Respondents were asked the percentage of use of various remarketing methods, and the chart above represents the averages of each method used. Online auctions are the most common remarketing method. “Other” methods include sealed bid, donation or sale to other agencies, destruction, lease return, and scrap recycling.