Photo: Insurify
Cities across the U.S. are in different stages of reopening due to COVID-19 and, for some, re-shutting down. The role of drivers in the American economy is likely to continue to see interesting and unpredictable shifts as the coronavirus pandemic remains a significant public health issue. To better understand the driving habits of different job sectors, the research team at Insurify looked to the data to determine the driving jobs with the best and worst records.
Insights
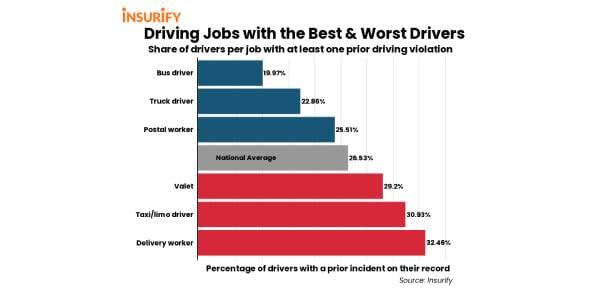
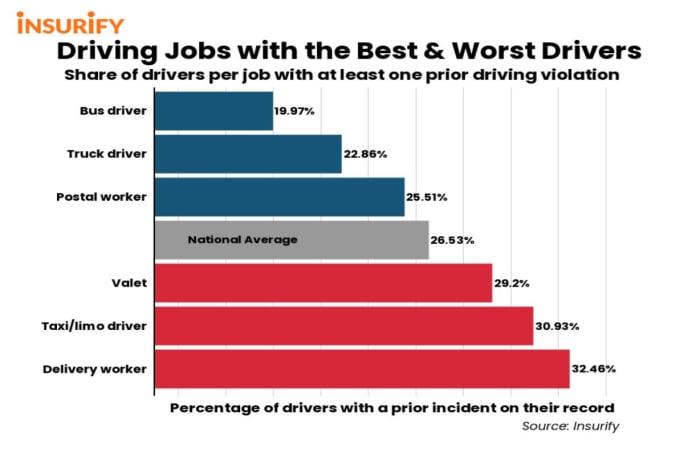
National averages. The average proportion of drivers with a prior incident on their record across all occupations (not limited to driving) is 26.53%. The mean annual wage across all occupations in the U.S. is $53,490. For driving jobs specifically, the mean percentage of drivers with a prior incident is 26.82%, and the mean annual wage is $43,465.
Public servants for the greater good. Interestingly, driving jobs with the best records are in the public or service sectors, such as public transportation, postal service, and cargo shipment. Likewise, drivers in the private sector who serve wealthier clientele have less-clean driving records. A potential reason for this disparity could be that drivers in the public and service sectors are held to a higher standard to uphold the law while driving, while drivers who work in more private and affluent settings are more motivated to satisfy their clients. If a passenger is late for their appointment or flight due to traffic, they may blame the driver, meaning customer satisfaction may hold precedent over abiding by driving laws for these workers.
Paying for quality. While pay is not significantly correlated with the cleanliness of a driving record, the jobs at the top of the list do have overall higher annual wages than those at the bottom. The top two driving jobs with the cleanest records earn annual wages higher than $45,000, while the bottom three earn less than $33,000. This trend suggests employees who earn more, and therefore may feel more valued and supported by their employer, exhibit higher integrity on the road.
Driving Jobs with the Cleanest Driving Records
3. Postal Worker
Percentage of drivers with a prior incident: 25.51%
Mean annual wage: $78,220
Number of people employed: 13,850
State with the highest concentration of jobs and location quotients: Alaska
The U.S. postal service is not only an integral public institution upon which our communities rely, but it is also an occupation composed of good drivers. The on-road incident rate of postal workers is below the national average and within the top three driving jobs with the cleanest records. Delivering mail along established routes requires knowledge and awareness of space and traffic patterns that likely contribute to postal workers’ stellar driving records. Postal workers across the country deserve recognition for their public service and conscientious driving habits.
2. Truck Driver
Percentage of drivers with a prior incident: 22.86%
Mean annual wage: $46,850
Number of people employed: 1,856,130
State with the highest concentration of jobs and location quotients: Arkansas
With an incident rate that’s 14% below the overall national average, truck drivers have the second-cleanest records across driving occupations. The pool of drivers within this occupation is vast, with 1.8 million truck drivers employed as of 2019. Given the need for efficiency and reliability in supply chain logistics, competent and safe driving on the part of truck drivers is a necessity. The skills needed to navigate cross-country roads towing heavy loads likely work to reduce truck drivers’ incident rate.
1. Bus Driver
Percentage of drivers with a prior incident: 19.97%
Mean annual wage: $45,830
Number of people employed: 179,510
State with the highest concentration of jobs and location quotients: Hawaii
Many Americans rely on the bus as their main source of public transportation, especially in cities that do not have local train or subway systems. Luckily, bus drivers have the cleanest driving records of the driving occupations on this list. On average, the percentage of bus drivers with an incident on their record is 25% lower than the national mean. Given the added difficulties bus drivers have faced during the pandemic from job shortages to non-socially distanced working conditions, their stellar driving records are worthy of recognition. Recently, the shortage of bus drivers across school districts has demonstrated their integral nature to our transportation systems — bus drivers do not just have some of the best driving records, but are essential to the economy and education infrastructure.
Driving Jobs with the Worst Driving Records
3. Valet
Percentage of drivers with a prior incident: 29.20%
Mean annual wage: $26,450
Number of people employed: 147,390
State with the highest concentration of jobs and location quotients: Hawaii
There may be more situations reminiscent of Ferris Bueller parking the Ferrari in the public garage than we realize, because valets have a driving incident rate that’s 10% higher than the national average. Parking attendants additionally earn less than the average annual wage, even for a driving job — their average yearly earnings of $26,450 are 40% below the national mean for driving occupations. Valet jobs were likely among the early casualties in terms of lay-offs and furloughs following the shutdown of most public venues. Additionally, people have become more wary of having strangers get into their vehicles. The role of valets and parking attendants throughout the pandemic have been slightly unstable, especially since many cities that reopened early are shutting down again.
2. Taxi/limo driver
Percentage of drivers with a prior incident: 30.93%
Mean annual wage: $33,210
Number of people employed: 700,030
State with the highest concentration of jobs and location quotients: Connecticut
Yes, we’re talking to you! Taxi and limo drivers have some of the worst driving records across all driving occupations. With an incident rate 15% higher than the national average, it’s clear taxi drivers do not take the utmost care in following the rules of the road. Taxi and limo drivers are often used to take people between locations, as opposed to other jobs on this list that primarily transport goods. The pressure to beat traffic and arrive on time for a flight or event likely contributes to the rushing and inevitable traffic violations that hike up these drivers’ incident rate.
1. Delivery person
Percentage of drivers with a prior incident: 32.46%
Mean annual wage: $30,230
Number of people employed: 444,660
State with the highest concentration of jobs and location quotients: Wyoming
It cannot be denied delivery workers are some of the emergent heroes of the pandemic. Without them, people in quarantine would not be able to receive necessities like cleaning supplies, new books, and the loungewear that’s replaced office attire. Likewise, the demand for delivery workers throughout the pandemic has increased dramatically, providing an opportunity for employment at a time when many companies are unable to hire. Perhaps given the pressing demand and relatively minimal requirements needed to become a delivery worker, drivers with this occupation have some of the least-clean driving records with an incident rate 19% above average. Despite these worse-than-average incident histories, however, delivery workers are still without a doubt invaluable to the pandemic-era new normal.
Methodology
To determine which driving jobs have the best and worst records, the data science team at Insurify, a website for auto insurance quotes comparison, analyzed its database of over 2.5 million car insurance applications. To receive quotes, drivers provide personal information and driving history, including their current occupation. Of applicants who drive for a living, the number with at least one recorded moving violation in the last seven years was compared against the total number of car owners in that driving profession to determine the percentage with a prior incident.
Data for specific occupations, including the mean annual wage, the number of people employed, and the state with the highest concentration of jobs and location quotients were extracted from the Bureau of Labor Statistics’ most recent reports in May 2019. It is important to note that due to the aforementioned COVID-related changes in these driving sectors, the statistics for the number of people employed in each occupation may not accurately reflect the current moment.