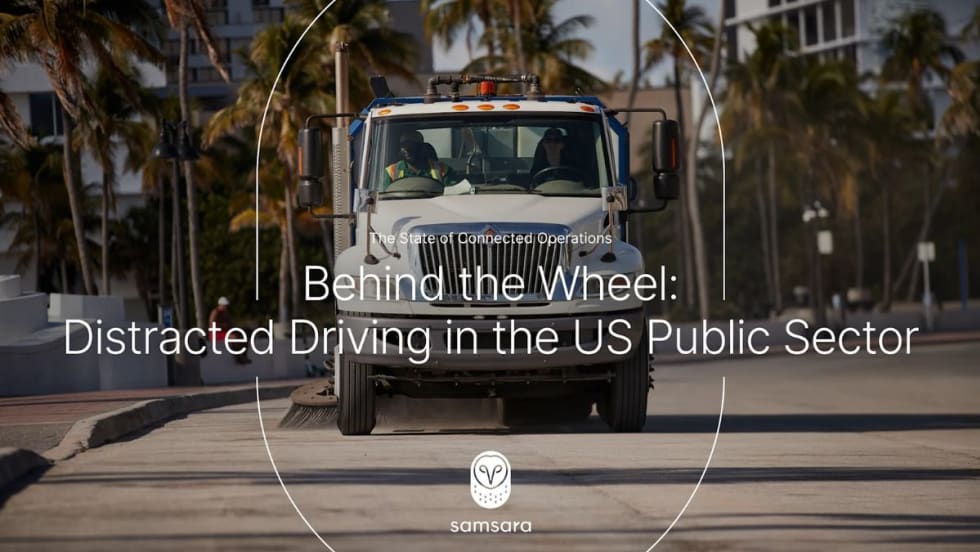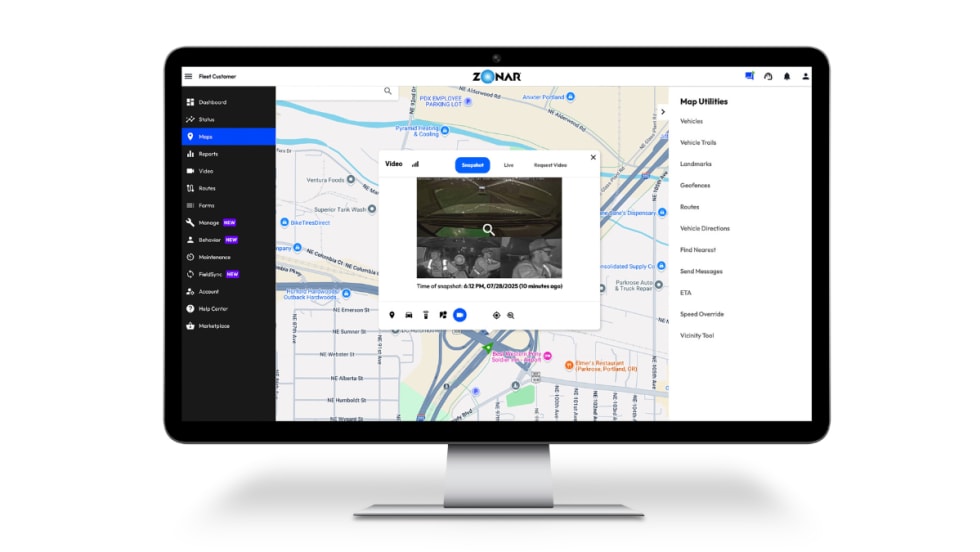
Photo: Samsara
For many leaders, collecting data from their own operations is just one part of the equation when it comes to powering the economy. Today, 46% of organizations are using external data sources to detect industry trends and get insights to drive efficiency, earn more revenue, and inform long-term planning decisions.
The importance of accessing external, open data is especially evident in the public sector. Government leaders are increasingly turning to smart city technology to understand the needs of its citizens. But data generated by smart city technology is often siloed, making it difficult to gain proper insights to inform initiatives serving your citizens, the environment, and public safety.
Samsara is introducing City Insights, a free resource for government leaders to access and explore commercial mobility trends within their cities.
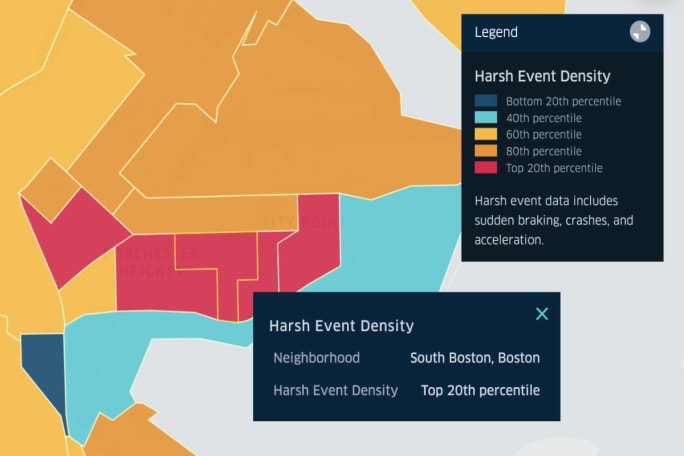
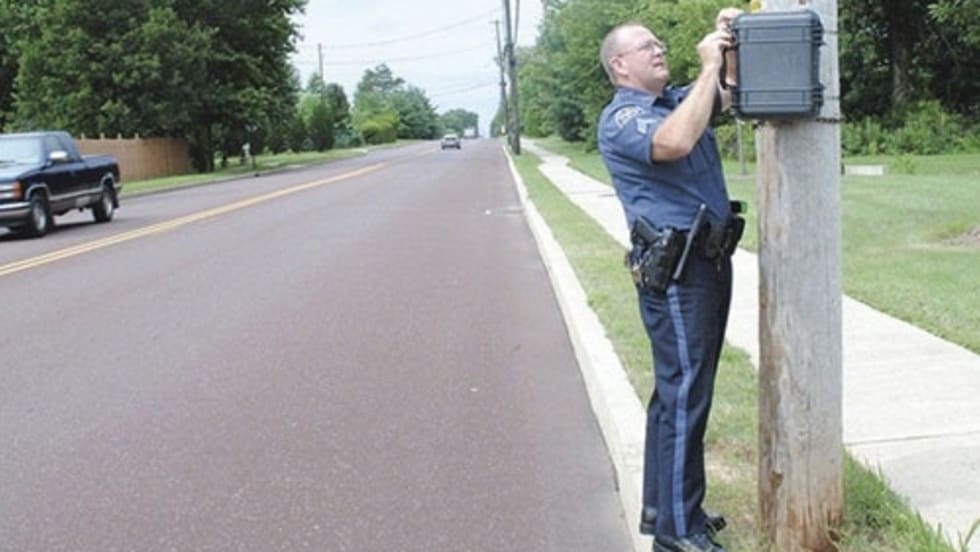
Photo: Samsara
How City Insights works
As Samsara has grown over the past few years, so has the scale, volume, and complexity of its data. Its IoT platform gathers 1.6 trillion sensor data points from over half a million vehicles on a yearly basis (that’s three million data points per minute). This data touches every aspect of its fleets’ operations—from vehicle speeds and miles driven to fuel efficiency, engine idling, harsh braking, distracted driving, and more.
City Insights aggregates and anonymizes data from over 15,000 fleets. Samsara chose to focus specifically on making it easy to explore data for harsh events and vehicle speeds. The National Safety Council estimates there are over 38,000 motor vehicle fatalities in the U.S. each year. A growing number of cities—including its customers at the City of Fort Lauderdale and City of Boston —have established Vision Zero initiatives to reduce traffic-related injuries and fatalities. City Insights provides additional context about commercial mobility within your city, so you can make better-informed decisions about your own safety initiatives.
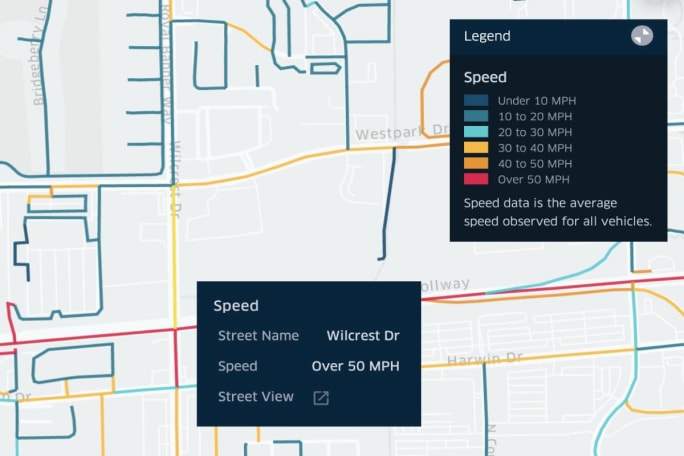
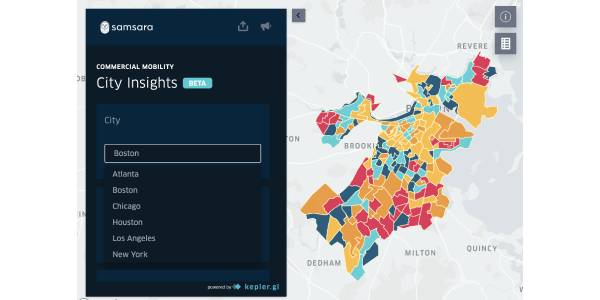
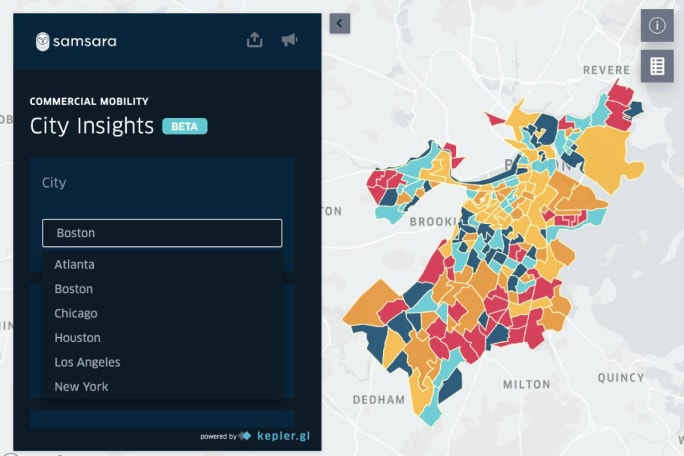
Photo: Samsara
Explore and Export Commercial Mobility Data
It’s evident cities use a wide range of tools to analyze data. City Insights provides the flexibility to access data in a variety of ways. Customers can explore visualizations directly in a web browser, or download raw data to incorporate into their own systems.
Within the browser, customers can interact with data in two main ways:
Street level: This view helps identify hotspots for unsafe driving behavior. Are vehicles traveling at reasonable speeds along arterial highways? Could streets with a high occurrence of harsh braking events benefit from clearer signage? Every segment is linked to Google Street View, so customers can remotely explore streets of interest without leaving their desk.
Neighborhood: Just as one can identify patterns for each street, one can also identify patterns for each neighborhood in their city. Do certain neighborhoods have a higher occurrence of harsh events? Businesses in those areas could be good candidates for educational outreach programs around safe driving best practices.
Samsara has also made it easy to download its data and layer it on top of your own. Just select your city, the type of metric you need, and whether you’d like to see data by street or neighborhood. Customers can analyze the mobility data with their own tools to get detailed insights. For example, layer data on top of accident reports to corroborate the location of hazard zones, or cross-reference harsh event hotspots with KSI (killed or seriously injured) data.
Methodology
● Street Level: Data is standardized based on road segments the US Geological Survey defines in its National Transportation Dataset .
● Neighborhood: Areas are determined based on neighborhood geographies published by each city.
● Harsh Events: The relative density of harsh events for a given road segment or neighborhood. Density is calculated as the total number of harsh events (harsh driving behavior + crashes) on a road or neighborhood divided by the total number of vehicles that have driven in that area. Roads and neighborhoods are ranked and the percentile ranking is displayed on the map.
● Speed: The expected speed in a given neighborhood or road segment. This helps you understand a street’s typical flow without the need for radar street signs. Expected speed is not a simple average, as values can be skewed by vehicles stopping at a traffic light or stop sign. Instead, Samsara takes the most frequently observed speeds grouped into 5 MPH buckets.
● In order to respect customer privacy, Samsara only shows data for streets and regions that have a minimum amount of driving information. Areas with low/no commercial traffic are excluded from this analysis, in order to both protect customer privacy and display statistically meaningful data.
● The City Insights dataset currently encompasses six U.S. cities (Atlanta, Boston, Chicago, Houston, Los Angeles, and New York), with plans to add more soon.